Setting Jenkins CI for python application
Jenkins is an open source automation server. It can run any task with sophisticated set of rules regarding source control and/or dependencies between jobs. It is used to automate all sorts of tasks such as building, testing, and deploying software. Jenkins can be installed through native system packages, Docker, or even run standalone by any machine with the Java Runtime Environment installed. In this article I will show how to set up automatic CI/CD pipelines for python applications using Jenkins.
Jenkins
It works on my machine!
How many times did you hear this sentence? Whenever I hear it, it is clear to me, that project has no Continuous Integration implemented. It is built and tested manually (at best) and it is always a bad idea.
Continuous integration is very powerful practice used during software development. And helps save tons of money. Bugs caught early cost ten times less, compared to the bugs spotted at production. Jenkins is considered one of the best DevOps tool, which maximizes chance to produce bug free software, which results in high quality software. It allows to quickly take the code, build it (step omitted in case of python packages, which usually do not require compilation step) on a frequent schedule and deploy into designated, representative environment for testing. Without the ability to automate code deployment, you are left with an enormous piece of manual, repetitive tasks in deployment pipeline:
- Get current software version from source control server
- Create test environment
- Install dependencies
- Test software (unit and integration tests)
- Deploy
This is typical pipeline in most IT projects. Jenkins can help to automate this work. And not only automate, but to establish common baseline for all developers working in the project. What is baseline? It is entire projects configuration and dependencies i.e. third party packages used in computation, environmental variables and other settings characteristic for the project.
Also, Jenkins is free and has over 1000 plugins, created by active community, which extend its functionality in every possible way. Plugins provide tools for many languages and functionalities developers around the world add for few decades now.
Jenkins fresh out of the box is not very appealing. When logged to the server, you should see following picture:
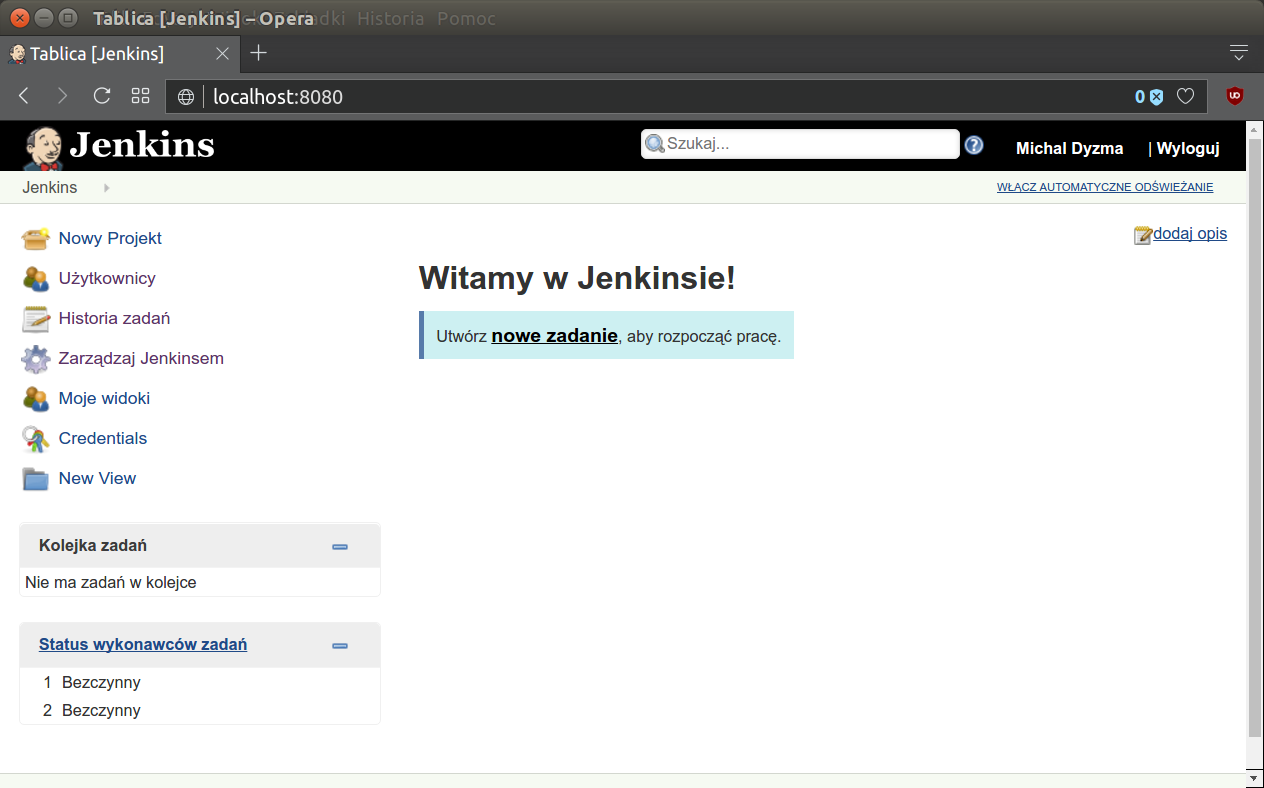
This is very basic view of Jenkins home page, which is crude and very old-school.
True power of Jenkins is within its plugins to support building, deploying and automating any project. Very promising is set of plugins grouped under common name Blue Ocean. It is new opening of the Jenkins UI. It has also lots of extensions integrating it with GitLab, GitHub or BitBucket, including very handy creators.
You can find basic tutorial about Blue Ocean UI functionalities on Jenkins Blue Ocean tutorial.
There are many ways of creating Jenkins pipeline:
- free style jobs combinations (not recommended)
- scripted pipelines
- declarative pipelines
In this post, but I will focus only on the last one, most recent and most feature rich and safest option.
Free style jobs chaining was common practice before. Its advantage was simplicity. Click here and there, add bash command to the form on the project page and voila. But when project reaches several dozens of stages communicating them becomes nightmare.
Much better approach is to move stages and their logic into separate groovy script. In scripted pipelines script is again block of code pasted in the projects form on Jenkins site. Single steps of the pipeline are encoded in Jenkins scripted language resembling groovy, so we have part of the pipeline moved to the cohesive script and use Jenkins internal structures, but it shares same disadvantage as previous solution. It exists only in Jenkins local configuration files. Once your Jenkins installation is gone, so is your pipeline.
The best solution is to keep everything under version control. In special files describing entire pipeline to any Jenkins instance. This is so called declarative pipeline. Let’s create special Jenkinsfile and put there some basic pipeline from the tutorial.
Setting up GitHub project
First we need to create GitHub repository (with LICENSE and .gitignore for example) and add Jenkinsfile to it. For this post I decided to create dummy project deployed to PyPI which will be simple Iris data set classifier. Basic project structure is:
.
├── .behaverc
├── .gitignore
├── irisvmpy
│   ├── __init__.py
│   └── iris.py
├── Jenkinsfile
├── LICENSE
├── Manifest.in
├── README.md
├── setup.cfg
├── setup.py
└── tests/
    ├── features
    │   ├── environment.py
    │   ├── iris.feature
    │   └── steps
    │       └── iris_steps.py
    └── test_iris.py
Project pushed to the GitHub repository H E R E. It is a simple Iris classifier using SVM. It contains all files necessary to build decent python project.
Basic pipeline structure, recommended on Jenkins pipeline documentation is as follows:
Jenkinsfile
pipeline {
    agent any

    stages {
        stage('Build') {
            steps {
                echo 'Building'
            }
        }
        stage('Test') {
            steps {
                echo 'Testing'
            }
        }
        stage('Deploy') {
            steps {
                echo 'Deploying'
            }
        }
    }
    post {
        always {
            echo 'This will always run'
        }
        success {
            echo 'This will run only if successful'
        }
        failure {
            echo 'This will run only if failed'
        }
        unstable {
            echo 'This will run only if the run was marked as unstable'
        }
        changed {
            echo 'This will run only if the state of the Pipeline has changed'
            echo 'For example, if the Pipeline was previously failing but is now successful'
        }
    }
}
Main block of each declarative pipeline is pipeline{} block. In pipeline one can define stages{}, as group of stage{} elements. Each containing specific steps{}, their order and logic. Beside stages{} one can also set pipelines properties{}, options{} or environment{} blocs. Also, some directives to the source control manager concerning frequency of checking GitHub repository for changes in triggers{} block (it accepts cron syntax). Check Crontab Guru for examples.
Jenkins allows running jobs on multiple machines in various configurations. So user usually can specify agent, which runs specific step or all steps included in the pipeline. Agent may be local jenkins instance, some virtual machine connected to it (and running different OS for example) or docker container run by host machine.
In this pipeline there is also extensive post{} block with some messages displayed on the screen under specific conditions. As their names indicate, some will always be displayed, some upon success or failure. Post part can be used to communicate with developer to send message about project status.
Three of them will be used in almost every project:
-
Always will be displayed every time Jenkins finishes. Useful when we want to archive logs, or clean up after each run.
-
Success only when no errors were noted during pipeline processing. Good to archive successful builds.
-
Failed is an option processed when pipeline failed. This variant of post part is very useful to send feedback to the team, via e-mail or other medium like slack channel, that something went wrong and changes committed lately did not pass regression tests and require urgent attention. When CI is tightly combined with delivery process (i.e. copying web app to the production server), post failure option may be used to roll back to the last successful build.
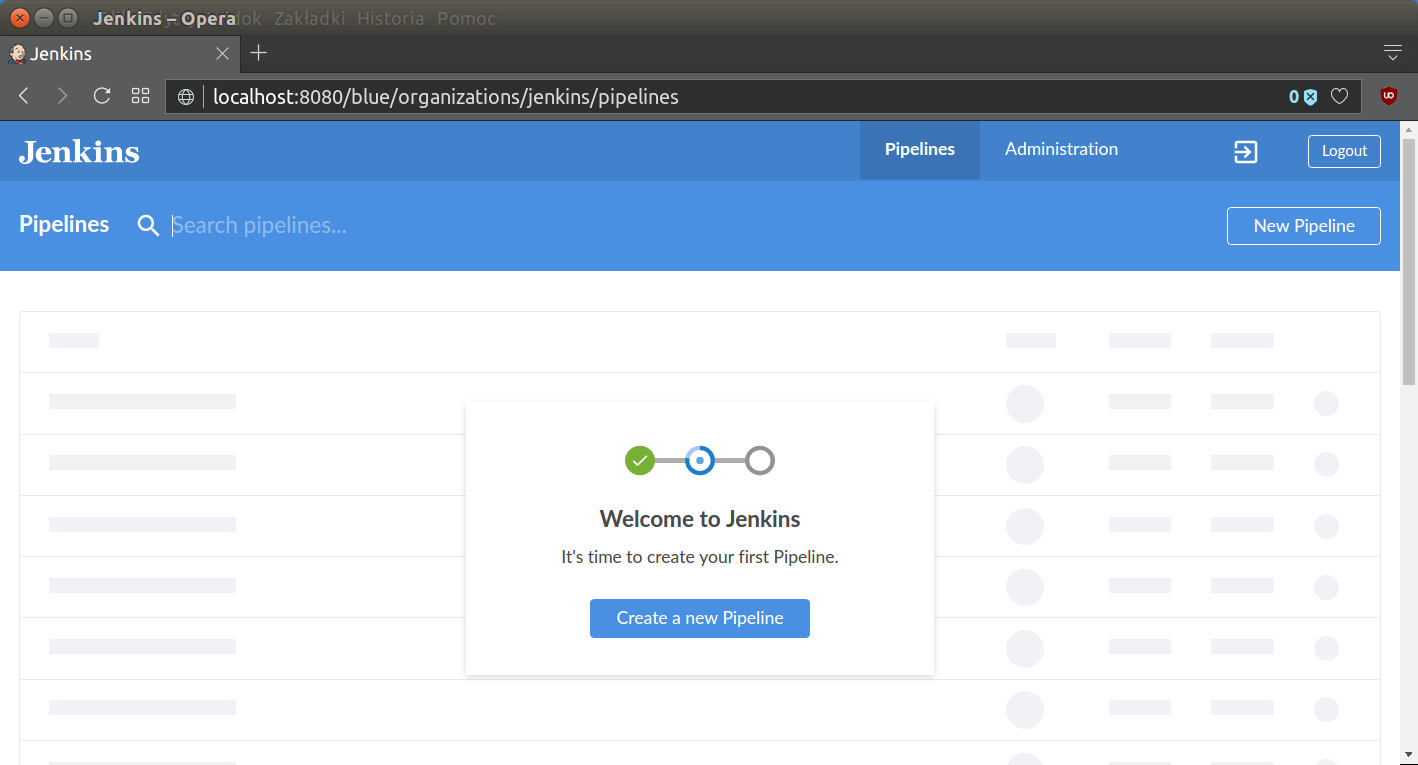
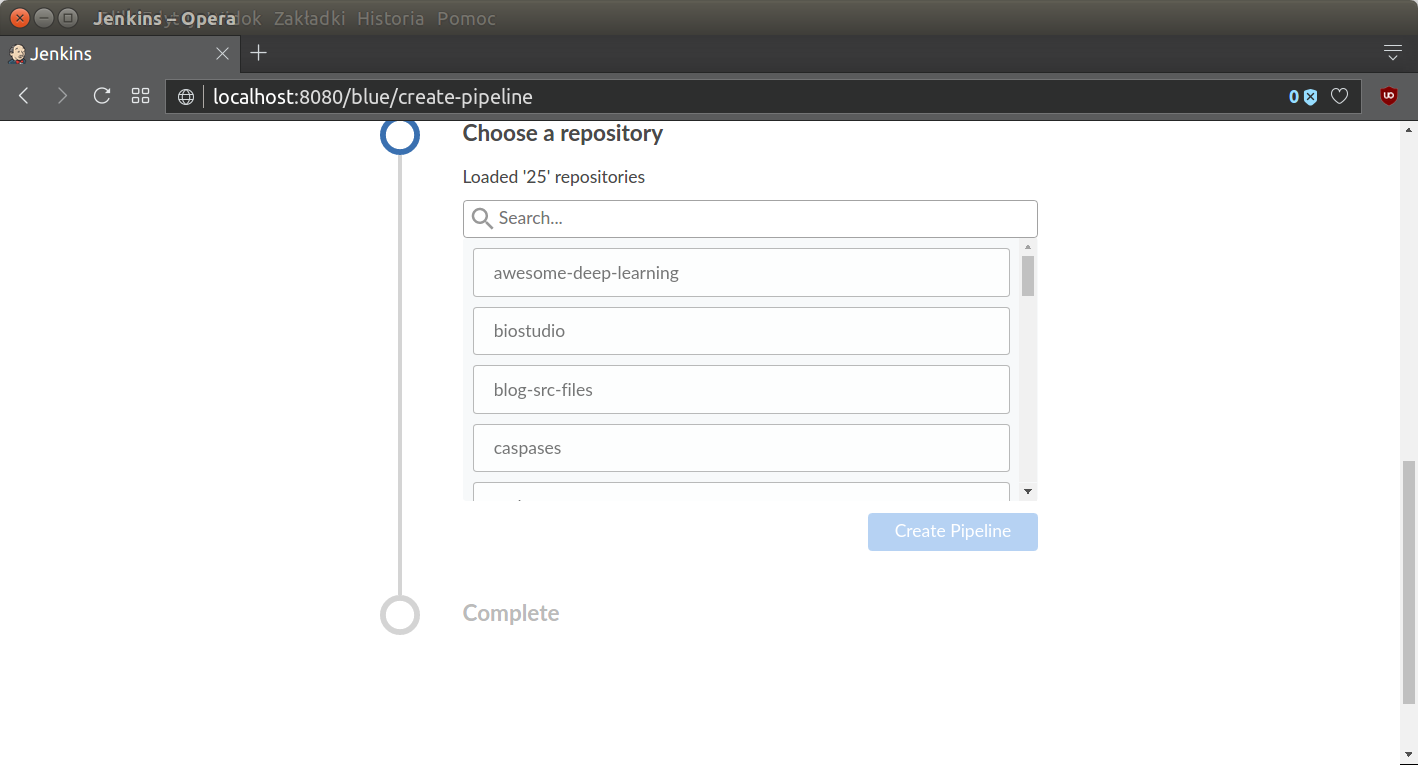
It is time to connect our project with Jenkins. To do that I will use Blue Ocean creator. First one needs to connect GitHub account with Jenkins user account (add Personal Access Token), then connect GitHub account. More details about pipeline creation and adding GitHub access token from scratch - here. In general process can be summed up in three slides:
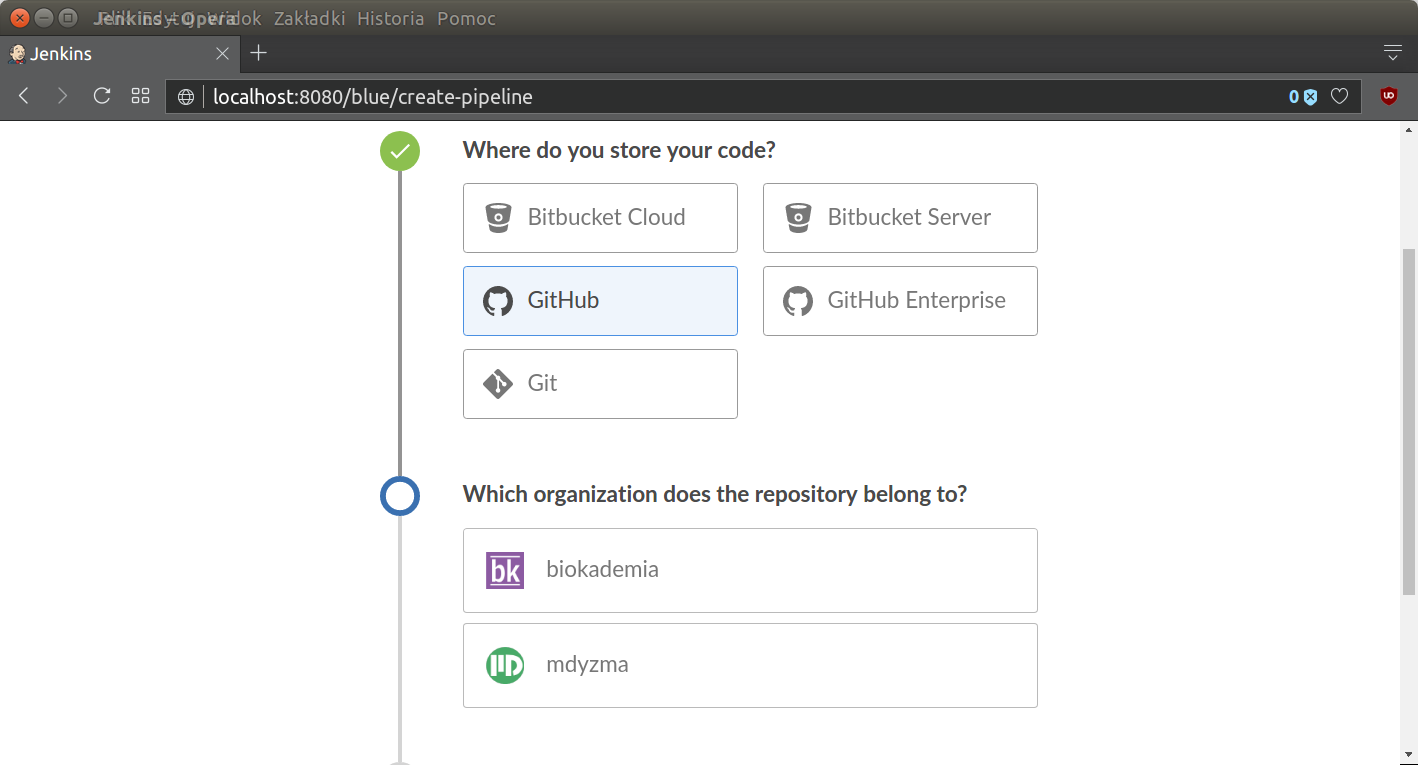
After that creator leads to specific repository:
and finally, Jenkins will auto-discover all steps from Jenkinsfile present in the repository. Alternatively one can use Blue Ocean Pipeline Editor and create everything using nice GUI based user interface. Pipeline will be displayed on the screen:
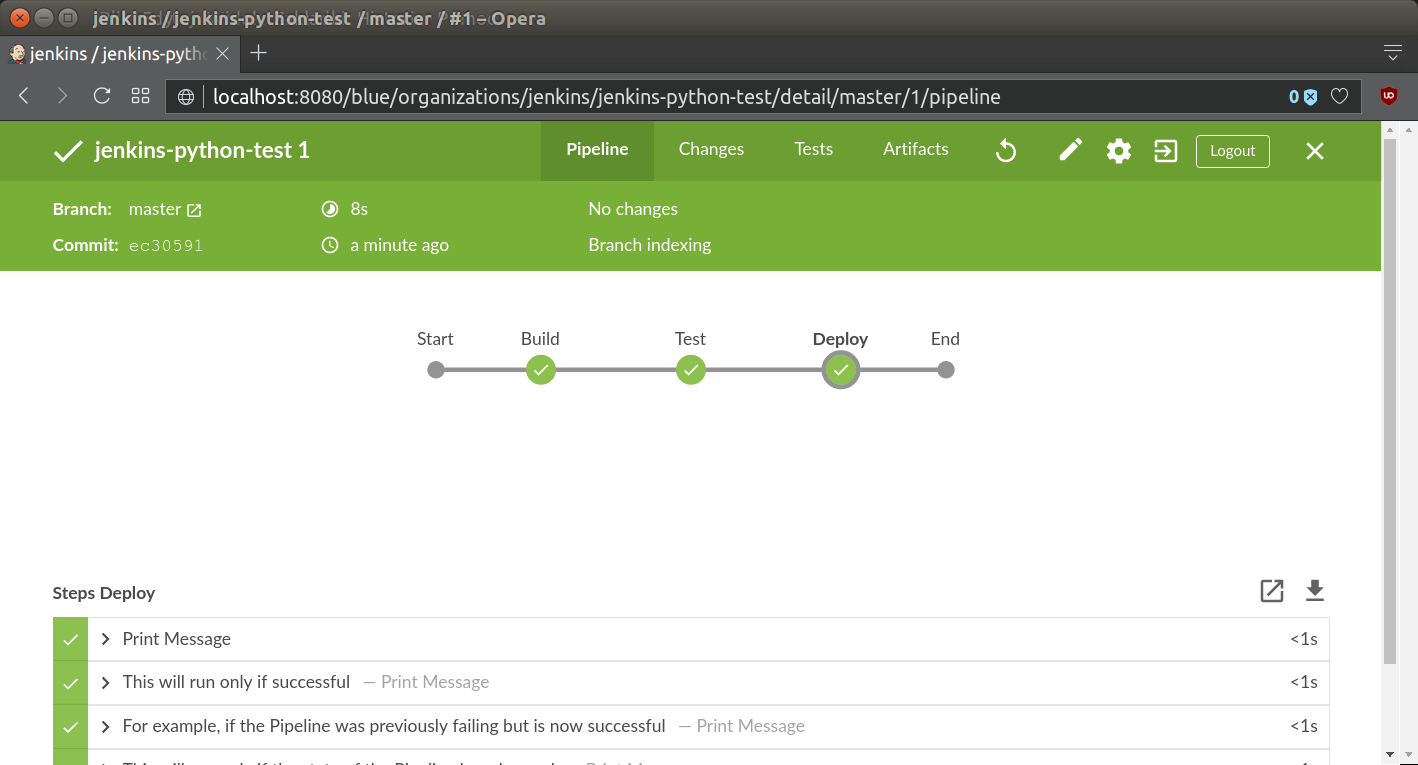
Jenkins will automatically run the pipeline and display all the messages, which apply, from the post section. In this case we will get green status, since Jenkinsfile is comprised just several echo statements.
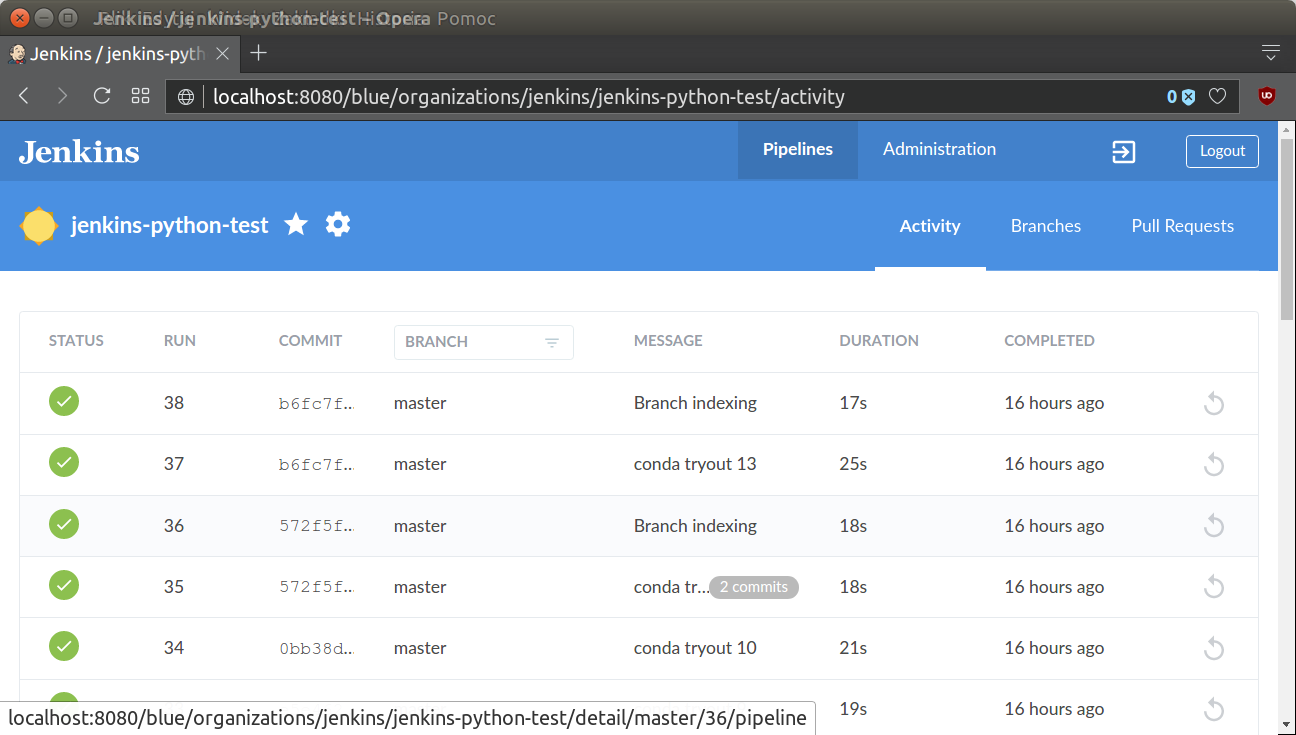
There is also a page summarizing statuses of all projects under this jenkins server control. General list of all projects on Jenkins server looks like this:
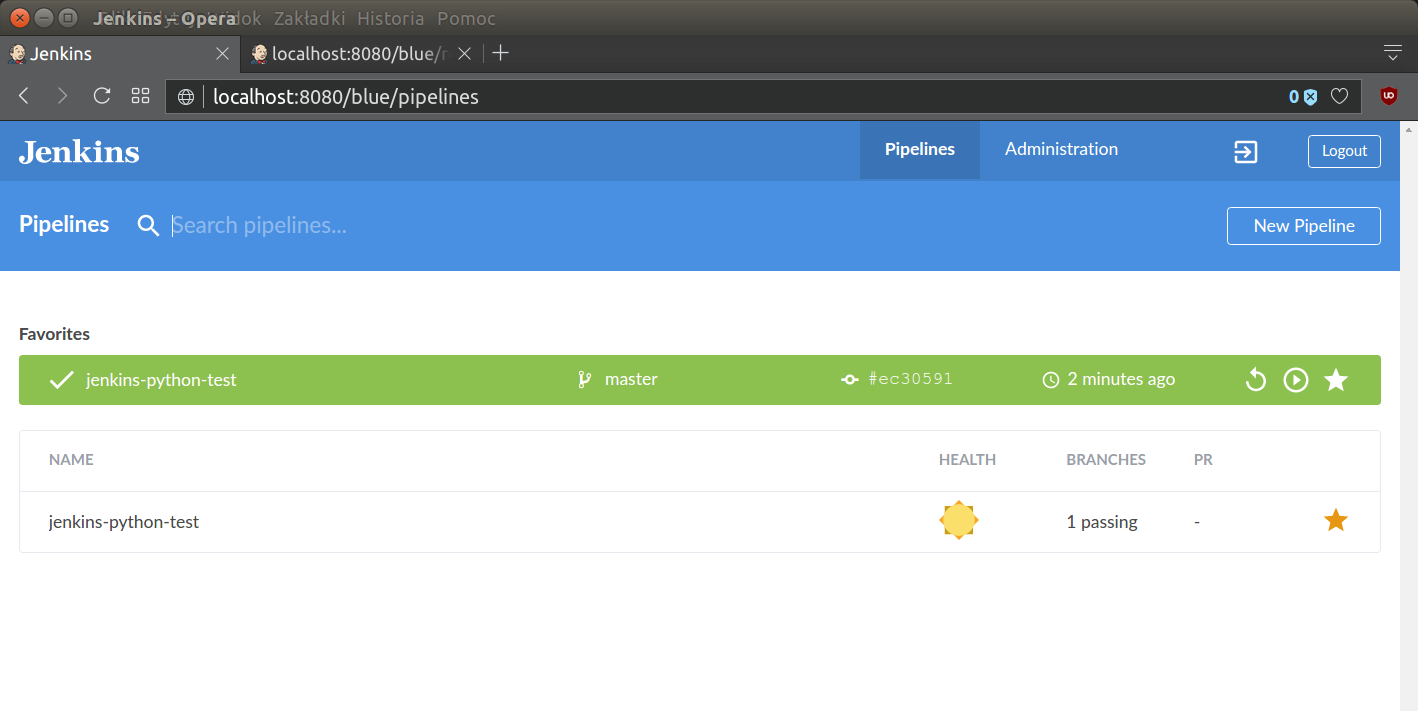
When the project is properly connected to the CI server, we can start extending pipeline to fit our needs.
Project steps
Unlike compiled languages, Python does not need a “build” stage per se, but Python projects can still benefit greatly from using Jenkins for continuous integration and delivery. In Python ecosystem there are tools which can be integrated into Jenkins for testing and reporting (i.e. unit tests runners (pytest, nose) or code metrics reports creators (pylint, Radon).
Traditionally our basic pipeline will comprise of the following elements:
- Creating test environment
- automatic source code pull (from GitHub)
- installing proper python version
- installing dependencies
- Running static code metrics:
- various raw metrics:
- tests coverage
- errors and style check
- Testing pulled source code
- unit tests
- integration tests
- Building proper python distribution package (
.whl) - Deploying to PyPI
It is time to rebuild our Jenkinsfile to reflect steps given above.
Jenkins anatomy
Jenkins uses its user service account to create job folders and files, manage work-space and its plugins. All configuration options are kept in .xml files in specific locations in Jenkins $HOME directory for jenkins user. On debian derived OS it is placed in /var/lib/jenkins/ directory. This is location of our agent, so called service account without interactive properties. It means it does not have designated shell, no /home/jenkins/ folder and one can not login to this account interactively.
In this directory Jenkins server stores information about its activity. Processed jobs in /var/lib/jenkins/jobs/ sub-folder (it contains logs and meta-data in .xml format for all or, specified number of runs, (this option can be set for each project). For example:
[mdyzma@devbox jenkins-python-test]$ tree /var/lib/jenkins/jobs/jenkins-python-test/branches/master
/var/lib/jenkins/jobs/jenkins-python-test/branches/master
├── builds
│   ├── 1
│   │   ├── 1.log
│   │   ├── 2.log
│   │   ├── 3.log
│   │   ├── 4.log
│   │   ├── build.xml
│   │   ├── changelog0.xml
│   │   ├── log
│   │   └── workflow
│   │       ├── 1.xml
│   │       ├── 2.xml
│   │       ├── 3.xml
│   │       └── 4.xml
│   ├── lastFailedBuild -> -1
│   ├── lastStableBuild -> 1
│   ├── lastSuccessfulBuild -> 1
│   └── legacyIds
├── config.xml
├── lastStable -> builds/lastStableBuild
├── lastSuccessful -> builds/lastSuccessfulBuild
├── name-utf8.txt
├── nextBuildNumber
└── scm-revision-hash.xml
Most important is config.xml, which is Jenkinsfile reflection and stores all steps, commands and logic translated to the xml format. Few years ago it was very important file, since it was used to back up all settings for Jenkins job and pipelines created via web UI. In our project all information is stored in Jenkinsfile.
Source code and its processing i.e. testing, is done in workspace sub-folder (/var/lib/jenkins/workspace/). This location is also accessible as a $WORKSPACE internal variable from the pipeline level.
Python environment for Jenkins
There are two bad news about jenkins and python virtual environments:
- Jenkins user by default uses shell (it means no
sourcecommand) - Jenkins user is non-interactive service account. It means it doesn’t run through the same set of scripts that alter the PATH environment variable for logged users. There is no
.bashrcand neither/etc/profilenor/etc/bash.bashrcconfigurations have any effect. As a consequence it usually uses interpreter located in/usr/bin/pythonor something like this (basic default system interpreter). If you have some Anaconda or Miniconda custom python installation in the system, there is a good chance, that jenkins will not see it.
There is also Jenkins special plugin called Shiny Panda, which allows managing python virtual environments in Jenkins, but I do not recommend it. It is easier and safer to configure proper python interpreter and environment using Miniconda and Jenkins settings.
So … Jenkins does not see our nice system Miniconda installation. We will have to make Jenkins use proper python interpreter and create virtual environments accessible in the workspace of the project every time job is run.
The best solution is to install Miniconda and manage environments from the jenkins user level. Miniconda will expose conda package manager, which is also capable to easily manage python virtual environments.
First, lets install Miniconda as jenkins user (all sh or bash command invoked in pipeline are executed as jenkins user), therefore we need to switch to the jenkins user and tell system what shell to use, since jenkins has none assigned by design. This set of commands will install latest miniconda in /var/lib/jenkins/miniconda3/:
[mdyzma@devbox jenkins-python-test]$ sudo su
[sudo] password for mdyzma: # sudo pass
root@devbox:/home/mdyzma/GitHub/jenkins-python-test# su - jenkins

$ cd /var/lib/jenkins # go to jenkins $HOME dir
$ wget https://repo.continuum.io/miniconda/Miniconda3-latest-Linux-x86_64.sh
...
71% [====================================================>       ] 41.491.372   508KB/s  eta 39s

$ bash Miniconda3-latest-Linux-x86_64.sh

Welcome to Miniconda3 4.3.31

In order to continue the installation process, please review the license
agreement.
Please, press ENTER to continue
>>>
Miniconda3 will now be installed into this location:
/var/lib/jenkins/miniconda3

- Press ENTER to confirm the location
- Press CTRL-C to abort the installation
- Or specify a different location below

...
installation finished.
Do you wish the installer to prepend the Miniconda3 install location
to PATH in your /var/lib/jenkins/.bashrc ? [yes|no]
[no] >>>  #say no
Modifying .bashrc of environment processing element was pointless. As I mentioned, Jenkins usually connects to the service via non-interactive shell, so neither /etc/profile nor /etc/bash.bashrc configurations would have any effect. To make it work two things need to be done:
- change main Jenkins shell to bash (this will activate
sourcecommand) - make conda binaries to be visible for jenkins user shell from the pipeline
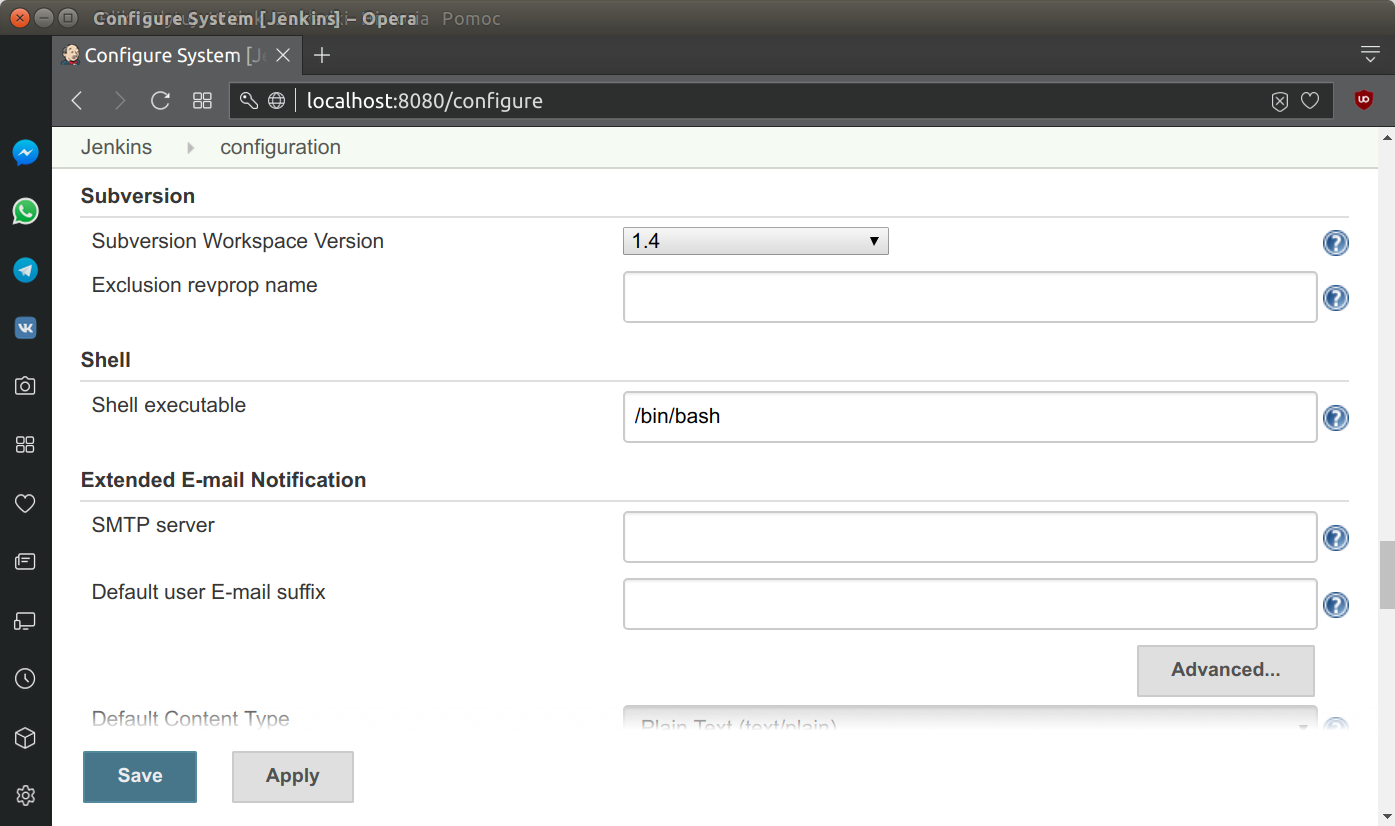
To activate source command we need to switch to Bourne-again shell (bash) as default shell. Go to Manage Jenkins -> Configure System -> Shell -> Shell executable (or http://localhost:8080/configure), and input /bin/bash into the form. Save changes.
Still, we have to expose miniconda binaries to the non-login Jenkins profile. Declarative Pipelines support an environment directive, which allows defining environmental variables. Environment directive used in the top-level pipeline block will apply to all steps within the Pipeline (see: Jenkins documentation). We will use it to modify PATH variable.
Now we can easily create and destroy python virtual environment within jenkins pipeline. We can also install all dependencies locally. The post block of the script will remove this environment when pipeline finishes.
Sadly, every time we call the sh command, jenkins will create new temporary shell. This means that if we use source activate in a sh it will be only sources in that shell session. Therefore, we have to activate env in each stage or new sh command we invoke. Let me show you how it looks like:
Jenkinsfile
pipeline {
    agent any

    triggers {
        pollSCM('*/5 * * * 1-5')
    }
    options {
        skipDefaultCheckout(true)
        // Keep the 10 most recent builds
        buildDiscarder(logRotator(numToKeepStr: '10'))
        timestamps()
    }
    environment {
      PATH="/var/lib/jenkins/miniconda3/bin:$PATH"
    }

    stages {

        stage ("Code pull"){
            steps{
                checkout scm
            }
        }
        stage('Build environment') {
            steps {
                sh '''conda create --yes -n ${BUILD_TAG} python
                      source activate ${BUILD_TAG}
                      pip install -r requirements.txt
                    '''
            }
        }
        stage('Test environment') {
            steps {
                sh '''source activate ${BUILD_TAG}
                      pip list
                      which pip
                      which python
                    '''
            }
        }
    }
    post {
        always {
            sh 'conda remove --yes -n ${BUILD_TAG} --all'
        }
        filure {
            echo "Send e-mail, when failed"
        }
    }
}
Basic frames for pipeline was enclosed in the listing above. GitHub is checked with */5 * * * 1-5 frequency (at every 5th minute on every day-of-week from Monday through Friday). Default code checkout was suppressed in pipeline options. In options, we have also established rules regarding keeping old builds (Round Robin rotation of last 10 builds) and we also established, that each log entry will be timestamped. During first stage we create conda environment and install all project dependencies. During second stage we check interpreter localization. There is also possibility to create separate environment for different python versions (i.e. 2.7 branch). All is needed is python version in create command i.e.: conda create --yes -n env_name python=2.
${BUILD_TAG} is a string created by Jenkins from combination of jenkins-${JOB_NAME}-${BUILD_NUMBER} variables. Convenient to put into a resource file or for easier identification of virtual environment.
Last, but not least is post block for entire pipeline. Always when pipeline finishes (regardless the status), conda environment will be purged from the disk.
Quick peek at conda envs list shows, that system works (38 jobs ran and there is only one - root environment):
[jenkins@devbox ~]$ conda env list
# conda environments:
#
root                  *  /var/lib/jenkins/miniconda3
Static code metrics
In this part we will configure static code analysis tools to determine complexity and non-standard practices in the code base. In attempt to provide top quality of the code, we can automate following checks to be done each time we commit changes:
- Raw code metrics:
- SLOC, comment lines, blank lines, &c. (
clockorsloccount) - Cyclomatic Complexity (i.e. McCabe’s Complexity)
- the Maintainability Index (a Visual Studio metric)
- SLOC, comment lines, blank lines, &c. (
- Code coverage reports (
coverage,pytest-cov) - PEP8 check (
pylint)
There is large diversity of formats among tools. They can produce reports as JSON, HTML and sometimes XML.
Coverage and pytest-cov produce XML outputs in JUnit format. Very good option to quickly obtain test coverage report and progress graph using basic jenkins plugins. .xml files very easily integrate with Jenkins toolkit. To process this reports we will use JUnit Plugin.
Pylint can generate its own output files, which can be read by Violation Columns Plugin.
Radon generates JSON outputs, which are the most problematic, since Jenkins does not have specific plugin for this tool. One possible option is to use allure tool to convert them to nice HTML reports and serve using general purpose HTML Publisher Plugin.
Let’s start with code raw metrics.
Raw code metrics
We will use Radon package to produce data in json format. Then json and report will be archived (moved to the build/ folder).
...
        stage('Static code metrics') {
            steps {
                echo "Raw metrics"
                sh  ''' source activate ${BUILD_TAG}
                        radon raw --json irisvmpy/ > raw_report.json
                        radon cc --json irisvmpy/ > cc_report.json
                        radon mi --json irisvmpy/ > mi_report.json
                        //TODO: add conversion and HTML publisher step
                    '''
            }
        }

...
Code coverage report
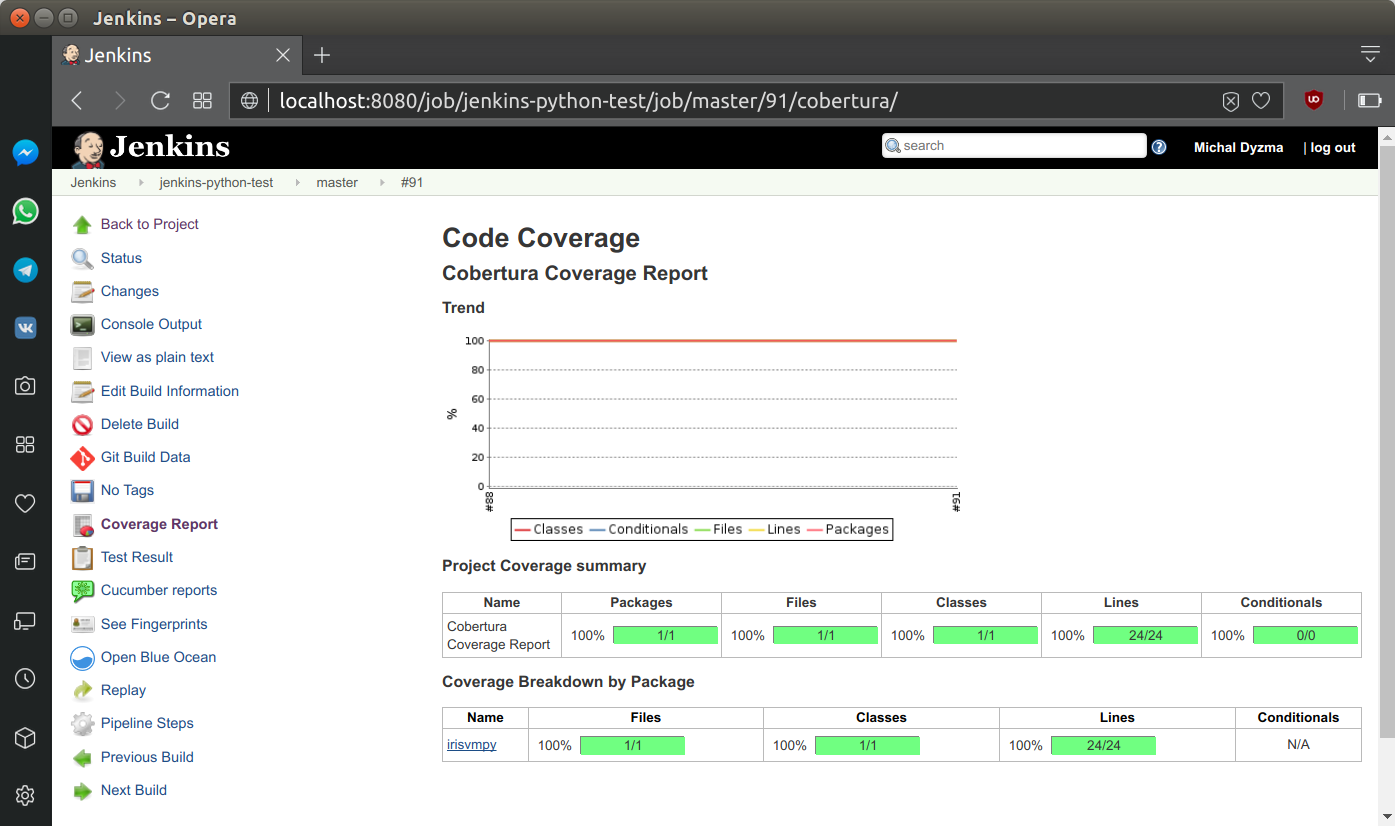
Jenkins has very powerful CoberturaPublisher Plugin. We will create proper .xml report with code coverage using coverage package and publish it to HTML using post section of this step. It will always grab info located in /reports/coverage.xml and transform it to the HTML report visible in the side menu of the Jenkins project.
...
        stage('Static code metrics') {
            steps {
                echo "Code Coverage"
                sh  ''' source activate ${BUILD_TAG}
                        coverage run irisvmpy/iris.py 1 1 2 3
                        python -m coverage xml -o ./reports/coverage.xml
                    '''
            }
            post{
                always{
                    step([$class: 'CoberturaPublisher',
                                   autoUpdateHealth: false,
                                   autoUpdateStability: false,
                                   coberturaReportFile: 'reports/coverage.xml',
                                   failNoReports: false,
                                   failUnhealthy: false,
                                   failUnstable: false,
                                   maxNumberOfBuilds: 10,
                                   onlyStable: false,
                                   sourceEncoding: 'ASCII',
                                   zoomCoverageChart: false])
                }
            }
        }
...
Code coverage report is accessible only from classical Jenkins view. It appears as a link on the left side menu and as a miniature in main project view.
PEP8 & code metrics reports
We can also check code errors and style violations. Unfortunately pylint has tendency to return a non-zero exit code even only if a small warning issue was found. Only when everything was fine, 0 is returned. All non-zero steps are signal for Jenkins to fail the pipeline. This is unacceptable in case of small style differences. In this situation I use pylint report as a “tip” and allow it to fail. My shell command will always return true.
...
        stage('Static code metrics') {
            steps {
                echo "PEP8 style check"
                sh  ''' source activate ${BUILD_TAG}
                        pylint --disable=C irisvmpy || true
                    '''
            }
        }
...
Testing
Two types of testing are essential:
- Unit tests (
pytestorunittest) - Integration tests (
behave)
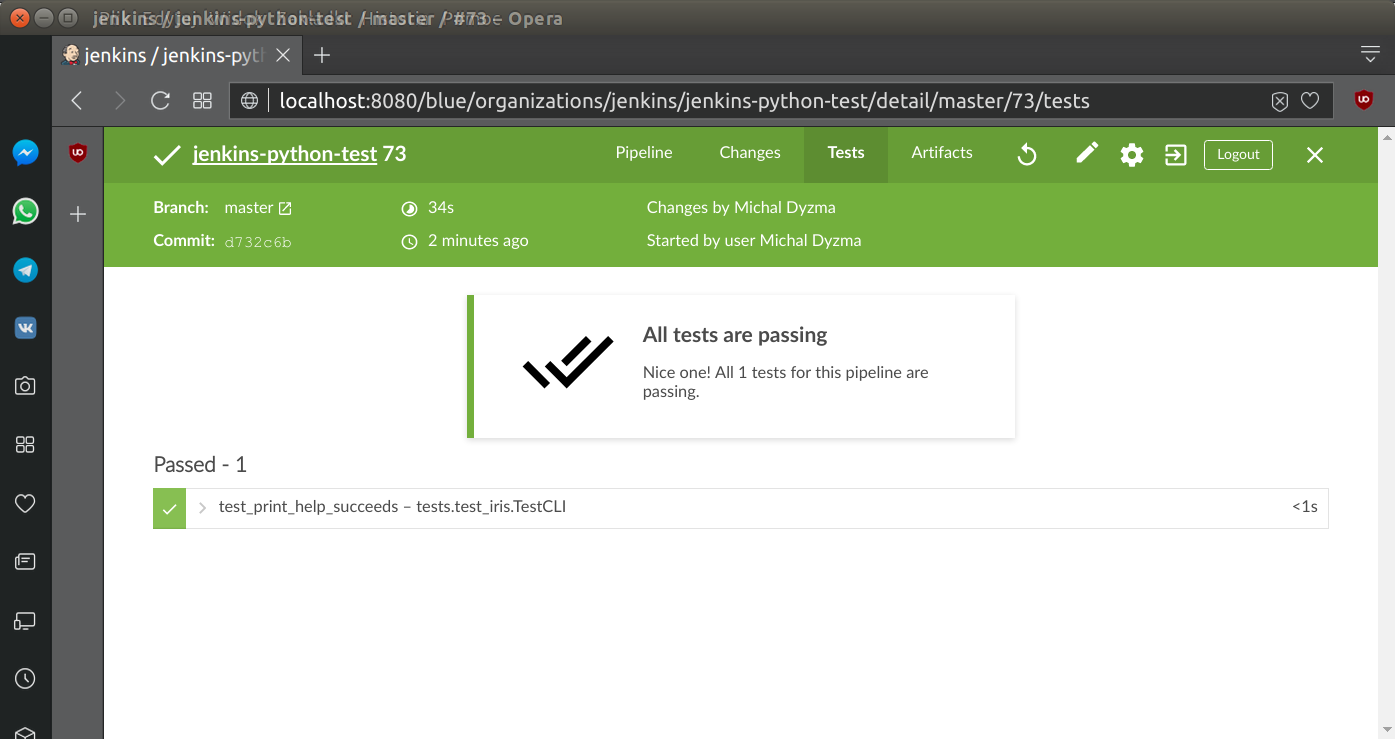
In case of more complex software integration tests may be added to the list. According to agile “outside-in” approach first we should write integration tests (more general test), then precise unit tests (classic TDD). Test results will be stored for comparison. JUnit plugin gives quick and easy access to the tests.
Unit tests
Stage with unit tests and their archiving:
...
        stage('Unit tests') {
            steps {
                sh  ''' source activate ${BUILD_TAG}
                        python -m pytest --verbose --junit-xml test-reports/results.xml
                    '''
            }
            post {
                always {
                    // Archive unit tests for the future
                    junit allowEmptyResults: true, testResults: 'test-reports/results.xml', fingerprint: true
                }
            }
        }
...
Tests report is accessible on special Tests tab:
Integration tests
Behave package is able to return results of integration tests in JSON format, however this format is not compatible with any Jenkins cucumber repoprt plugins. There is a workaround to this problem. Actually two.
- Use custom json formatter (there is gist published on GitHub with formatter compatible with cuccumber plugin style)). How to use user-specific formatters with behave, please checks behave documentation.
- Use
behave2cucumberpackage, which adds another dependency to te project. Also, last post post in this discussions suggests, thatbehave2cucumberfails in some cases.
first option
...
        stage('integration tests') {
            steps {
                sh  ''' source activate ${BUILD_TAG}
                        behave -f=formatters.cucumber_json:PrettyCucumberJSONFormatter -o ./reports/integration.json
                    '''
            }
            post {
                always {
                    cucumber (fileIncludePattern: '**/integration*.json',
                              jsonReportDirectory: './reports/',
                              parallelTesting: true,
                              sortingMethod: 'ALPHABETICAL')
                }
            }
        }
...
second option
...
        stage('integration tests') {
            steps {
                sh  ''' source activate ${BUILD_TAG}
                        behave -f=json.pretty -o ./reports/integration.json
                        python -m behave2cucumber ./reports/integration.json
                    '''
            }
            post {
                always {
                    cucumber (fileIncludePattern: '**/integration*.json',
                              jsonReportDirectory: './reports/',
                              parallelTesting: true,
                              sortingMethod: 'ALPHABETICAL')
                }
            }
        }
...
Building python package
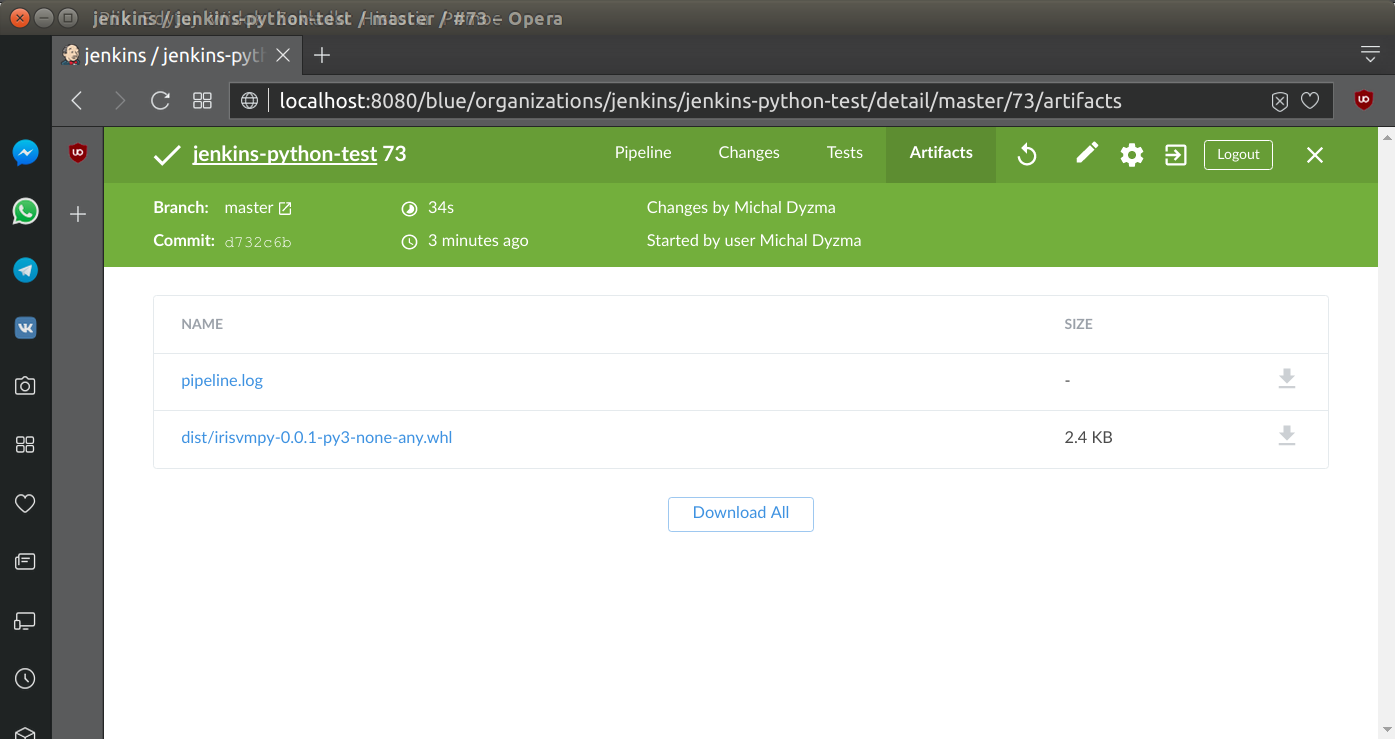
We will also build wheel package when all tests and code metrics was completed. Jenkins will check internal variable currentBuild.result. If nothing changed or there was no failure, Jenkins will initialize setup.py script. When build process is finished Jenkins will archive .whl file and store it for download. Blue Ocean and classical Jenkins create “Artifacts” page with all files marked to archivisation during pipeline run.
...
        stage('Build package') {
            when {
                expression {
                    currentBuild.result == null || currentBuild.result == 'SUCCESS'
                }
            }
            steps {
                sh  ''' source activate ${BUILD_TAG}
                        python setup.py bdist_wheel
                    '''
            }
            post {
                always {
                    // Archive unit tests for the future
                    archiveArtifacts allowEmptyArchive: true, artifacts: 'dist/*whl', fingerprint: true)
                }
            }
        }
...
As we can see python package was archived as expected:
Deployment
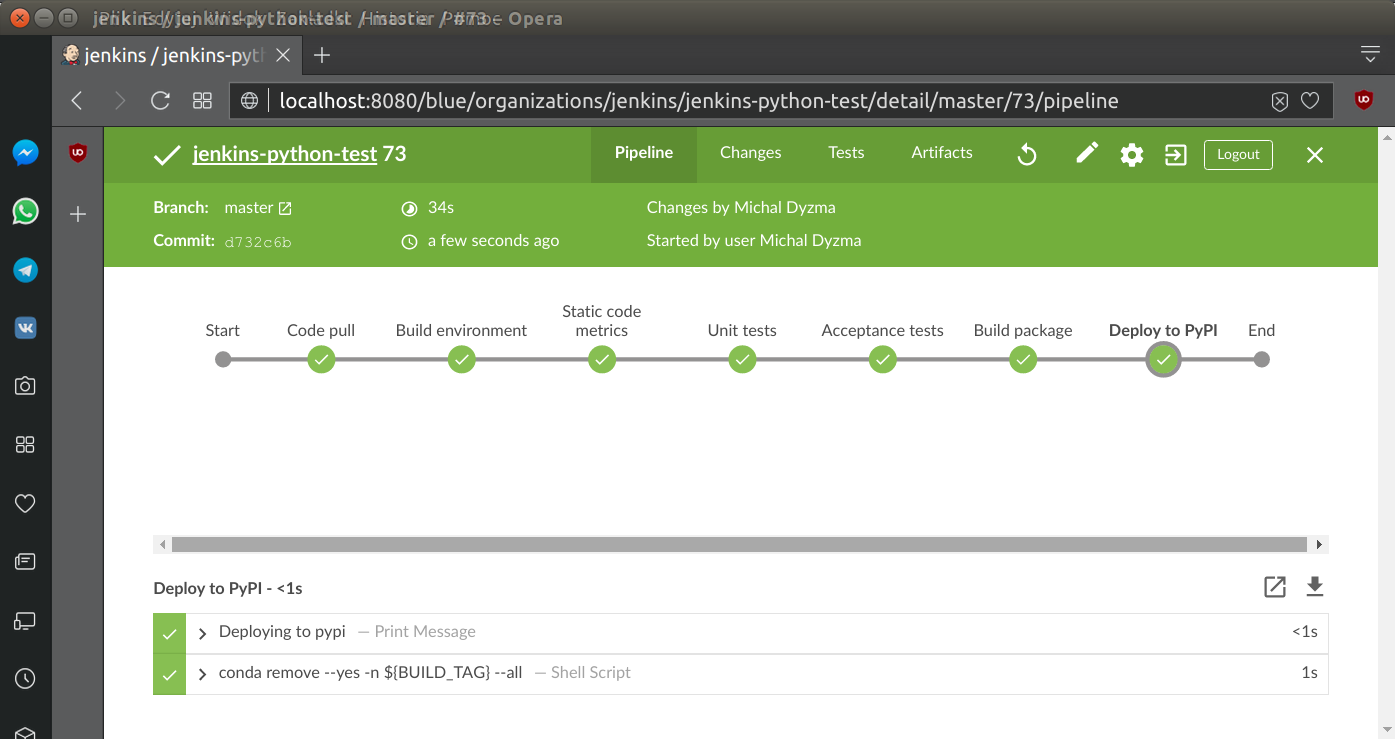
Package, which passed tests and was successfully built will be uploaded to PyPI server.
...
        stage("Deploy to PyPI") {
            }
            steps {
                sh "twine upload dist/*"
            }
        }
...
Summary
To summ up. Here is listing of the complete Jenkinsfile:
pipeline {
agent any
triggers {
pollSCM('*/5 * * * 1-5')
}
options {
skipDefaultCheckout(true)
// Keep the 10 most recent builds
buildDiscarder(logRotator(numToKeepStr: '10'))
timestamps()
}
environment {
PATH="/var/lib/jenkins/miniconda3/bin:$PATH"
}
stages {
stage ("Code pull"){
steps{
checkout scm
}
}
stage('Build environment') {
steps {
echo "Building virtualenv"
sh ''' conda create --yes -n ${BUILD_TAG} python
source activate ${BUILD_TAG}
pip install -r requirements/dev.txt
'''
}
}
stage('Static code metrics') {
steps {
echo "Raw metrics"
sh ''' source activate ${BUILD_TAG}
radon raw --json irisvmpy > raw_report.json
radon cc --json irisvmpy > cc_report.json
radon mi --json irisvmpy > mi_report.json
sloccount --duplicates --wide irisvmpy > sloccount.sc
'''
echo "Test coverage"
sh ''' source activate ${BUILD_TAG}
coverage run irisvmpy/iris.py 1 1 2 3
python -m coverage xml -o reports/coverage.xml
'''
echo "Style check"
sh ''' source activate ${BUILD_TAG}
pylint irisvmpy || true
'''
}
post{
always{
step([$class: 'CoberturaPublisher',
autoUpdateHealth: false,
autoUpdateStability: false,
coberturaReportFile: 'reports/coverage.xml',
failNoReports: false,
failUnhealthy: false,
failUnstable: false,
maxNumberOfBuilds: 10,
onlyStable: false,
sourceEncoding: 'ASCII',
zoomCoverageChart: false])
}
}
}
stage('Unit tests') {
steps {
sh ''' source activate ${BUILD_TAG}
python -m pytest --verbose --junit-xml reports/unit_tests.xml
'''
}
post {
always {
// Archive unit tests for the future
junit (allowEmptyResults: true,
testResults: './reports/unit_tests.xml',
fingerprint: true)
}
}
}
stage('Integration tests') {
steps {
sh ''' source activate ${BUILD_TAG}
behave -f=formatters.cucumber_json:PrettyCucumberJSONFormatter -o ./reports/integration.json
'''
}
post {
always {
cucumber (fileIncludePattern: '**/*.json',
jsonReportDirectory: './reports/',
parallelTesting: true,
sortingMethod: 'ALPHABETICAL')
}
}
}
stage('Build package') {
when {
expression {
currentBuild.result == null || currentBuild.result == 'SUCCESS'
}
}
steps {
sh ''' source activate ${BUILD_TAG}
python setup.py bdist_wheel
'''
}
post {
always {
// Archive unit tests for the future
archiveArtifacts (allowEmptyArchive: true,
artifacts: 'dist/*whl',
fingerprint: true)
}
}
}
stage("Deploy to PyPI") {
}
steps {
sh "twine upload dist/*"
}
}
}
post {
always {
sh 'conda remove --yes -n ${BUILD_TAG} --all'
}
failure {
emailext (
subject: "FAILED: Job '${env.JOB_NAME} [${env.BUILD_NUMBER}]'",
body: """<p>FAILED: Job '${env.JOB_NAME} [${env.BUILD_NUMBER}]':</p>
<p>Check console output at "<a href='${env.BUILD_URL}'>${env.JOB_NAME} [${env.BUILD_NUMBER}]</a>"</p>""",
recipientProviders: [[$class: 'DevelopersRecipientProvider']]
)
}
}
}Running entire pipeline results all green, successful run: